TECHNOLOGY STRATEGY · ALIGNBIZ INSIGHTS
The Case for Technology Cartography™ as a Framework for Smarter IT Investment
By Steve Gordon · Managing Director, AlignBiz Consulting · B.S. Geography, M.S. Planning
Ask any senior IT leader how much their organization spends on technology each year and you’ll get one of two answers. Either a number stated with surprising confidence or a long pause followed by something like “well, it depends on how you count it.”
That pause is worth paying attention to. Because in most organizations, the honest answer is: nobody really knows.
Not completely. Not accurately. Not in a way that connects every system, every contract, every cloud subscription, and every integration dependency into a single coherent picture. The tools exist in silos. The budgets live in spreadsheets owned by different departments. The contracts were signed by people who may no longer work there. And somewhere in the middle of all of it, critical business decisions are being made about what to build, what to replace, what to keep without a reliable map of the terrain.
That’s the problem Technology Cartography™ was built to solve.
What Is Technology Cartography™?
The name is intentional. Cartography the science and art of mapmaking is exactly what’s missing from most organizations’ approach to their technology investments. I come to this framing honestly: my academic background is in Geography and Urban Planning, fields that are fundamentally about understanding complex systems by mapping them. The insight that drives those disciplines — that you cannot manage, plan, or improve a landscape you haven’t first accurately charted translates directly to how most organizations fail to manage their technology investments. They have inventories. They have asset registers. They have vendor lists. But an inventory is not a map.
A map shows you relationships. It shows you what’s connected to what, what’s upstream and downstream, what would fail if a single system went dark, and critically what the whole thing is costing you.
Technology Cartography™ is AlignBiz’s methodology for building that map. It organizes an organization’s technology landscape into four distinct layers, Customer, Operations, Analytics, and Governance and maps every significant system, its cost, its interdependencies, and its relative health. The result isn’t a slide deck. It’s a navigational tool that leadership teams can use to make smarter decisions about where to invest, where to cut, and where the hidden risks are buried.
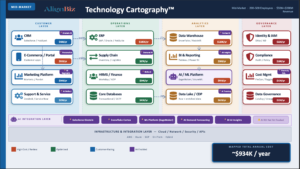
A sample Technology Cartography™ map for a mid-market organization mapping systems, costs, AI integration, and interdependencies across four layers. Total mapped annual spend: ~$934K.
Why This Matters More Than Ever
For most of the last decade, technology spending grew fast enough that the lack of visibility was easy to overlook. Cloud contracts auto renewed. New SaaS tools proliferated. AI features got bundled into existing subscriptions. Nobody had time to stop and ask whether all of it was working together or whether the collective sum of those individual decisions made any strategic sense.
That era is ending. Economic pressure, tighter budgets, and the explosion of AI-related spending have forced a reckoning in boardrooms and finance committees that weren’t asking hard questions about IT a few years ago. Suddenly, “what are we spending and what are we getting for it?” is no longer just an IT question. It’s a business question. And most organizations aren’t equipped to answer it well.
When you map your technology landscape properly by layer, by actual cost, by integration dependency three things consistently happen.
First, you find money you didn’t know you were spending. Redundant tools. Overlapping capabilities. Licenses nobody is using. The numbers are often surprising to leadership teams who assumed someone else was tracking this.
| Zylo’s 2025 SaaS Management Index — analyzing over $40 billion in real enterprise SaaS spend — found that organizations waste an average of $21M annually on unused licenses, with roughly half of all provisioned licenses going unused. The average company also carries 15 duplicative online training apps, 11 project management tools, and 10 team collaboration apps. Gartner projects global SaaS spending will reach $300 billion in 2025. The scale of invisible waste embedded in that number is staggering.
Sources: Zylo 2025 SaaS Management Index; Gartner, 2024 |
Second, you find risk you didn’t know you were carrying. Single points of failure. Systems that dozens of downstream processes depend on but that haven’t been meaningfully updated in years. Governance gaps where data is moving across systems with no clear ownership or compliance framework. These risks don’t announce themselves you have to map your way to them.
Third, you create a shared language for decisions that previously happened in isolation. When the CFO, CTO, and business unit leaders are all looking at the same map, they stop arguing from their own partial views of the landscape and start making decisions from a common picture of reality. That alignment alone tends to pay for the exercise.
The AI Dimension
There’s a fourth thing worth naming one that’s becoming impossible to ignore. AI is now woven into nearly every layer of the technology stack, often in ways that aren’t visible, aren’t governed, and aren’t tracked.
At smaller organizations, employees are individually subscribing to AI productivity tools ChatGPT, Copilot, Grammarly with no central policy and no budget accountability. At mid-market scale, AI features are embedded in CRM, data warehouse, and HR platforms that were purchased for entirely different reasons. At the enterprise level, AI is a significant investment consuming hundreds of thousands to millions of dollars annually, often without a governance framework proportionate to the spend or the risk.
A well-constructed technology map surfaces all of this. It makes the AI layer visible which tools are active, which are ungoverned, which are delivering measurable value, and which are simply adding to the noise. The map in the illustration above includes an AI Integration Layer for exactly this reason: because in 2025, any technology map that doesn’t account for AI is already incomplete.
The Starting Point
The biggest barrier to adopting a cartographic approach isn’t technical. It’s organizational. Someone must own the map and in most companies, nobody does. IT sees part of it. Finance sees another part. Business units see their own slice. But the whole picture belongs to everyone and therefore to no one.
That’s where outside perspective helps. AlignBiz brings Technology Cartography™ as a structured engagement not a years-long project, but a focused effort to build the map, identify the highest-value opportunities, and put the right conversations in front of the right decision-makers.
The organizations that manage technology well in the next five years won’t necessarily be the ones with the biggest budgets or the most sophisticated tools. They’ll be the ones that know what they have and make intentional decisions about it. That starts with a map.
| About the Author
Steve Gordon is Managing Director of AlignBiz Consulting. He holds a B.S. in Geography and an M.S. in Planning disciplines that inform his belief that the most powerful thing you can do with a complex system is map it accurately. With 35+ years of technology leadership experience spanning IBM, Teradata, and AWS, he brings deep fluency in the enterprise analytics ecosystem and the vendor, tool, and buyer dynamics that shape mid-market and enterprise technology decisions. He is a TDWI speaker and the creator of Technology Cartography™. align-biz.com |